|
Editor’s Note:
Allen He is
a Director, and Jessica
Pollock is
a Research Associate at FCLTGlobal. This post is based on their
FCLTGlobal memorandum. |
Data from year-end
2022 shows
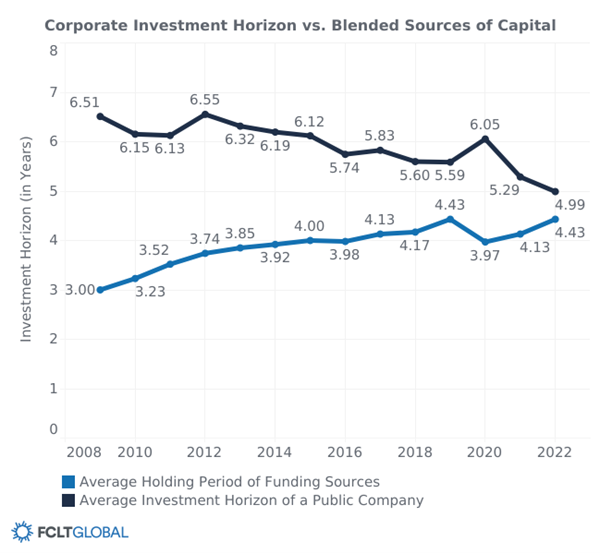
the investment horizon gap between companies and investors [1] remains
slim, though for the first time since our tracking began, investors
are leading with longer investment horizons than companies. On paper,
closer alignment of investment horizons between providers and users of
capital may appear to be a positive development for value creation in
capital markets. However, ‘closer’ doesn’t necessarily equal ‘better’.
While the past year reflects a continued long-term upward trend in
investor horizons, it also revealed a material decline in investment
horizons for corporates. This raises questions about the potential for
corporates’ long-term value creation. Specifically, the material
reduction in corporate investment horizons over the last two years
brings them to their lowest value since FCLTGlobal’s tracking began.
Furthermore, the increasing horizons can be attributed more to changes
in portfolio composition than to a fundamental shift in investment
behavior. It is important to note that the effects of these trends
vary significantly across geographies, sectors, and even within asset
classes. We highlight a few of the key drivers in corporate and
investor investment horizon changes below.
Companies’ investment horizons shortened in 2022
Companies in 2022 underwent a notable shift in investment strategies,
resulting in companies shrinking their investment horizon. This
reduction, from 5 years 4 months in 2021 to 5 years in 2022, was
primarily driven by two key factors: an upsurge in buybacks and a
decrease in retained earnings. As businesses increasingly opted to
repurchase their own shares and allocate fewer funds to retained
earnings, they experienced a shorter-term orientation to capital
deployment. This shift reflects a changing landscape, indicating a
stronger emphasis on immediate return of capital to investors in the
corporate world.
Spotlight on buybacks and
retained earnings
Globally in 2022, despite an overall 17% decrease in total uses of
capital, buybacks emerged as an outlier, showing both an absolute and
percentage point increase compared with previous years. Companies
reached an unprecedented high of $1.29 trillion in buybacks,
indicating a substantial upward trend compared to the curbing that
took place during the start of the pandemic in 2020. The surge in
buybacks can be attributed to favorable monetary policies and
companies’ accumulation of excess earnings and cash on their balance
sheets since 2021.
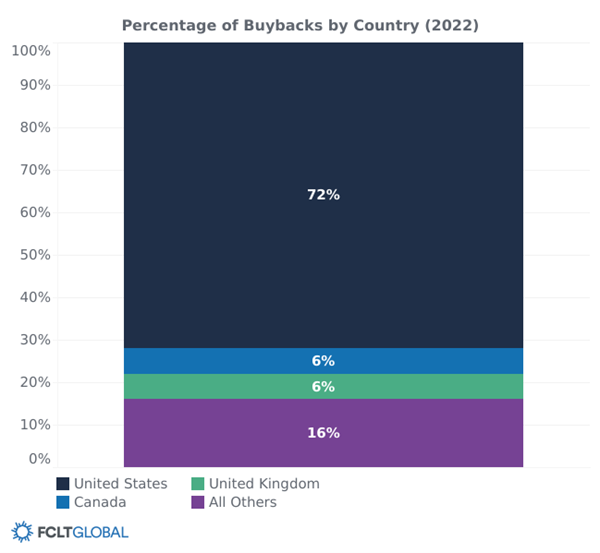
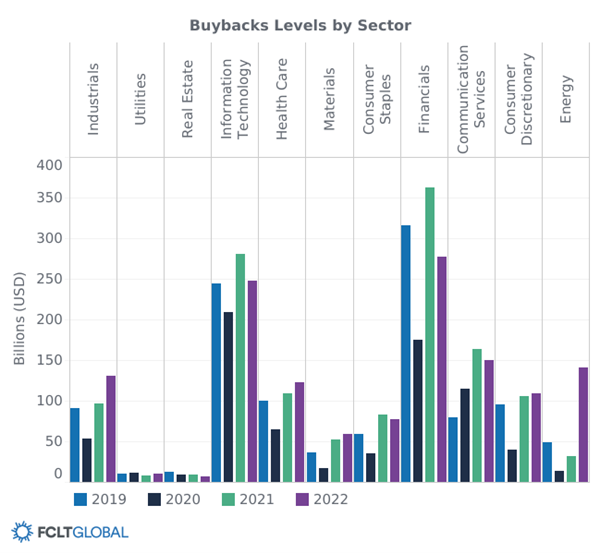
US companies have underpinned this buyback spree in recent years, as
have the Finance and Information Technology sectors globally. In 2022,
the Energy sector played an outsized role in buybacks as rising prices
generated higher earnings while fossil fuel companies continue to
implement their climate transition strategies. More broadly, this data
highlights a trend among corporates, particularly in the US, to
strategically invest in their own stocks by allocating excess capital
towards buybacks while enjoying substantial financial strength.
R&D expense, a continued bright light (but for how much longer)?
Yet recent assessments indicate that buybacks may not have been the
most prudent use of capital. According to Fortuna advisors, a
financial consultancy, the
return on investment (ROI) for buyback programs hit the lowest on
record for any five-year period since they began tracking
the metric in 2017. Additionally, buyback programs are inherently
reliant on a bullish market to produce significant value. However,
with increasing market volatility, companies need to determine whether
continued significant spending on buyback programs is the right move,
or risk over-catering towards the immediate short-term return of value
to their shareholders.
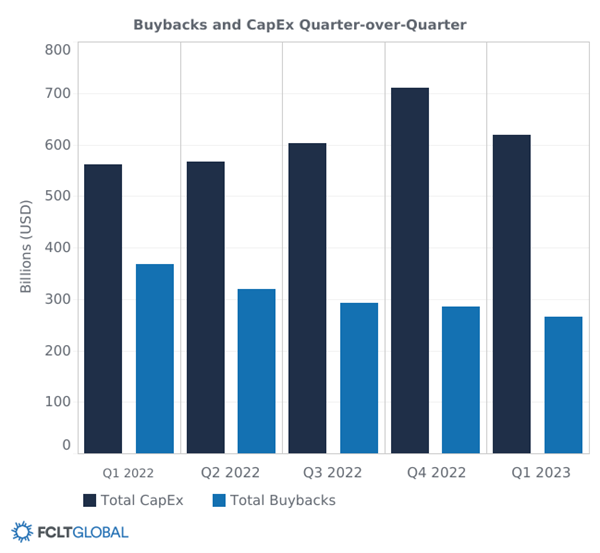
A Look-ahead to 2023
As fiscal and monetary policies tightened in the second half of 2022,
there has indeed been a slowdown in buyback activity, with the amount
spent on buybacks peaking during Q1 2022. Companies’ inclination to
“buy high” during periods of peak stock prices has also contributed to
this tapering off, and it is especially interesting that at this same
time, companies have begun spending more on capital expenditures.
Heading into H2 2023, it will be important to monitor how companies
choose to spend their capital, and its subsequent effect on corporate
investment horizons.
How the changing
environment (rising interest rates) affects retained earnings
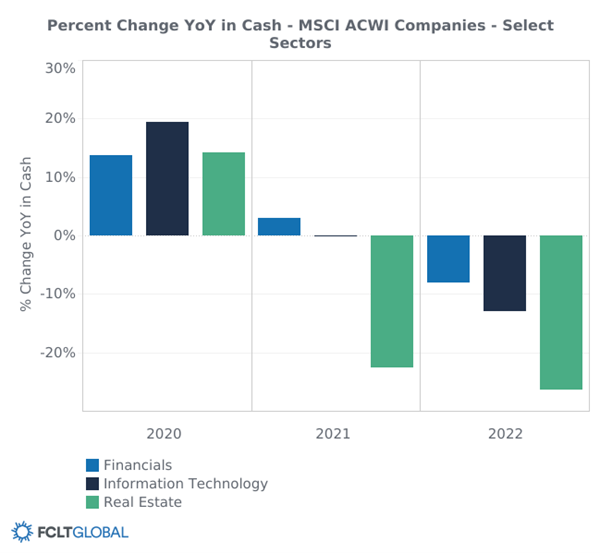
Retained earnings and cash both decreased as earnings were deployed
elsewhere
The changing economic environment has also prompted corporates to
materially reduce retained earnings in favor of other uses such as
interest expense due to rising rates. It has led corporates,
especially in sectors like financials, real estate, and information
technology, to start spending the precautionary cash reserves held on
their balance sheets for pandemic and resilience efforts over the last
two years.
This shift in uses of capital does carry risk. Less cash on hand can
mean less resilience in the event of negative shocks – as seen in the
recent collapse of Silicon Valley Bank, the Russian invasion of
Ukraine, and the pandemic. In particular, the financial sector has
seen a substantial decline in retained earnings. This might foreshadow
reduced resilience and future sector challenges, consistent with the
rise in bank downgrades and negative outlooks.
R&D expense, a continued bright light (but for how much longer)?
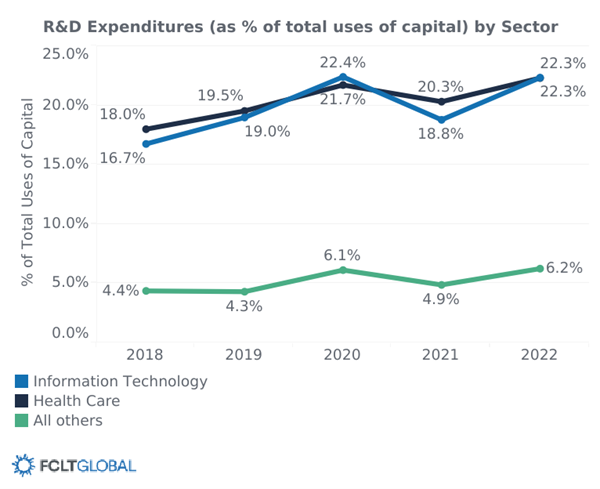
One solace for capital deployment is the continued increase in
research & development (R&D) spending, as innovation funded by R&D is
a critical driver of long-term value creation. Throughout the
pandemic, R&D spend has been the only use of capital to have increased
both in percentage and absolute value year-over-year. We see in Figure
X (chart above) that the information technology and health care
sectors have led the way, especially during the early pandemic. The
generalized boom over the past decade in R&D spending includes
spending for advancements like the human genome project, CRISPR, and
advances in AI and climate tech.
Investors’ seemed to become longer-term in 2022
Unlike their corporate counterparts, overall investor horizons
increased from 5 years 3 months in 2021 to 5 years 5 months in 2022.
However, this improvement resulted not from lower turnover and
improved long-term management practices, but from a rise in the
underlying share of indexed equities and longer duration in fixed
income instruments.
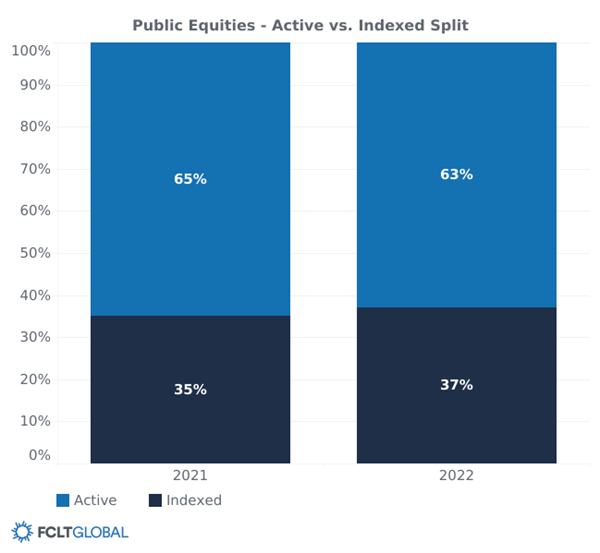
Public equity investment horizons have gotten longer-term
overall – but not due to lower portfolio turnover
Public equity investment horizons lengthened by 6 months
year-over-year between 2021 and 2022. The primary driver was a shift
in equity composition from active to indexed strategies, as the latter
have much longer investment horizons.
Here it is worth noting that turnover increased in
actively-managed portfolios as well as some indexed portfolios, which
would normally lead to shorter investment horizons.
Indeed, the downturn and turbulence in stock markets in 2022, combined
with the strategic repositioning of portfolios, led to higher turnover
in active equity portfolios investment and caused investment horizons
for these assets to decrease from 2 years 10 months in 2021 to 2 years
7 months in 2022.
In contrast to active equity, overall turnover for indexed equities is
marginally lower in 2022, implying investment horizons are slightly
higher. Underneath this aggregate number, however, the uptick in
volatility led to more major index rebalancing, with more companies
added to and removed from indexes, increasing turnover.
As such, while overall investment horizons for public equities
increased, the changes are more due to indexed
equities making up a larger portion of total assets under management rather
than any specific improvements in turnover industry practices. Fixed
income investment horizons have also increased overall – but effects
vary by subclass.
There is a similar nuance to
the fixed income investment horizons, which increased from 4 years 8
months in 2021 to 4 years 10 months in 2022. However, it is worth
noting that not all subclasses experienced a lengthening of investment
horizons and durations.
Interest rates have increased significantly across many jurisdictions
in 2022, leading to higher volatility to the asset class overall.
However, higher interest rates have notably different effects on
different subclasses of fixed income instruments.
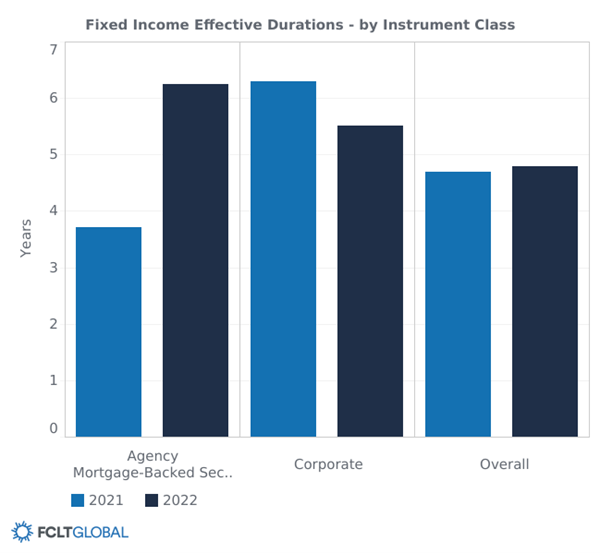
Specifically, the durations of instruments like mortgage-backed
securities and asset-backed securities tend to increase as rates rise
due to lower expected prepayments. We see that MBS durations have
indeed increased from 3 years 9 months in 2021 to 6 years 3 months in
2022. By contrast, higher interest rates for corporates tend to have
the opposite effect, as it becomes more costly to roll over debt and
companies look to alternative sources of capital. We do see that
corporate durations have decreased from 6 years 3 months in 2021 to 5
years 6 months in 2022.
What to make of the horizon
gaps?
Narrow gaps and longer horizons aren’t necessarily indicators of
strategic long-term behavior
The data indicates that corporates are adopting shorter-term
investment strategies and alarm bells should be ringing. Though the
gap between the investment horizons of corporates and investors
remains small, and investors appear to have gotten longer-term in
2022, this doesn’t necessarily imply a positive change, as it may not
reflect longer-term behaviors on the part of investors. Overall, it is
essential for both corporates and investors to carefully evaluate
their strategies to ensure they align with long-term value-creation
and financial resilience.
Endnotes
1This
data only includes asset managers as this data is currently available.
The savers data (i.e. pensions, insurance companies, households, SWFs
etc.) typically come out later in the calendar year. Check back here
in December for fully updated information.(go
back)
|
Harvard Law School Forum
on Corporate Governance
All copyright and trademarks in content on this site are owned by
their respective owners. Other content © 2023 The President and
Fellows of Harvard College. |