Deep Dive
Another way to play AI stocks: These companies, including Nvidia, have
been the most efficient chip makers.
Last
Updated: July 1, 2023 at 8:40 a.m. ET
First Published: June 26, 2023 at 11:19
a.m. ET
—
By Philip
van Doorn
You can broaden your exposure to the AI
and semiconductor space by adding stocks of companies with high
returns on invested capital.
|
Nvidia and Intel
both made a list of semiconductor manufacturers with the highest
returns on invested capital. .
MARKETWATCH/ISTOCKPHOTO |
How should you play a long-term trend in the stock market? Investors
have made an early bet on years of deployment of artificial
intelligence across the corporate world by focusing on data-center
infrastructure. This year the big bet has been on Nvidia Corp. — the
stock has returned 189% this year, with dividends reinvested.
On June 15 we screened semiconductors to
identify 16
industry players expected to increase sales at a compound annual
growth rate of at least 15% through 2025.
Nvidia NVDA ranked
fourth, but it is now an expensive stock. Below is a screen of 60
makers of computer chips and related hardware showing which companies
have made the most efficient use of invested capital over the past
five years. This approach may be a starting point for your own
research into stocks that can broaden your exposure to the AI
build-out.
Too expensive?
First, let’s take a look at valuations. Here is Nvidia’s year-to-date
price chart through Friday:
|
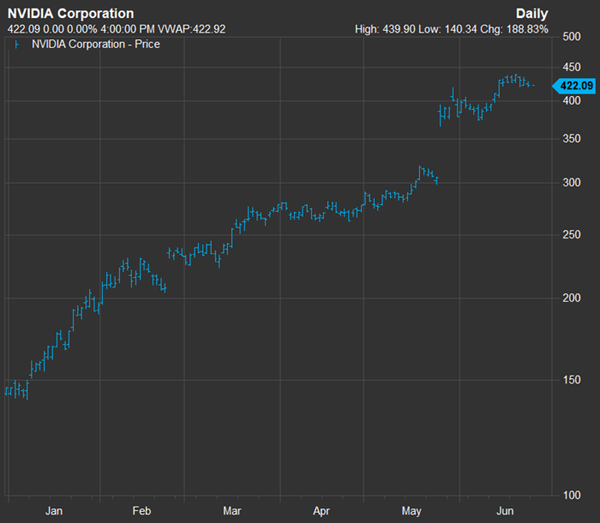
FACTSET
|
The stock popped 24% on May 25 after Nvidia
projected a
50% sequential increase in sales for the current quarter,
with that expectation tied to the
adoption of the company’s graphics processors for AI computing in
data centers.
Now let’s take a look at Nvidia’s valuations
compared with those of the S&P 500 SPX,
and the iShares Semiconductor ETF SOXX, which
tracks the PHLX Semiconductor Index SOXX, of
30 manufacturers of computer chips or related hardware.
Here are forward price-to-earnings ratios, based on weighted rolling
consensus estimates for 12 months among analysts polled by FactSet:
|
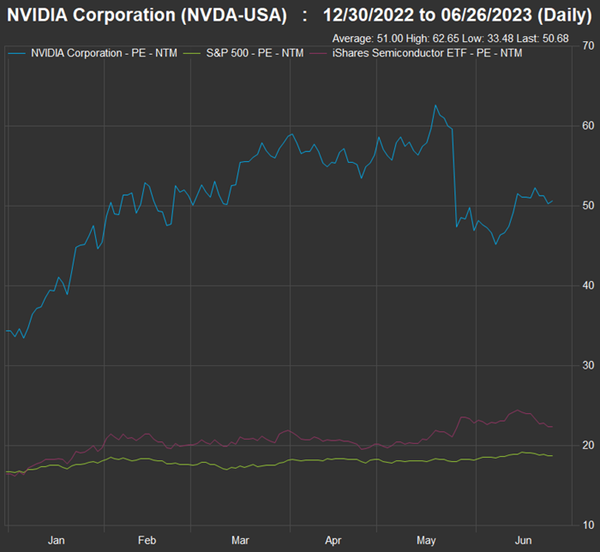
FACTSET
|
And now, forward price-to-sales ratios:
|
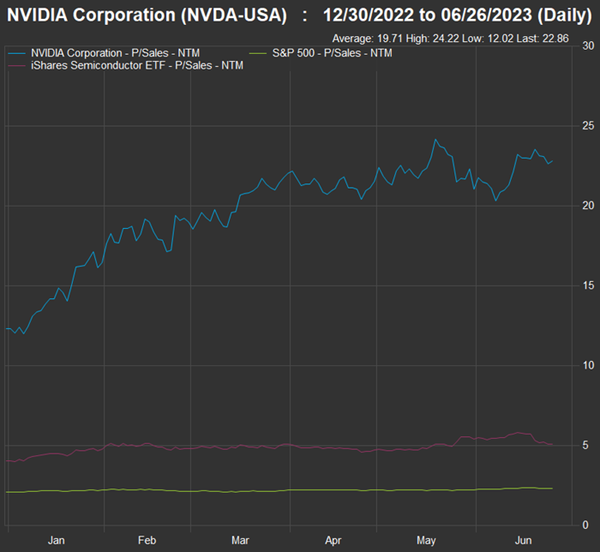
FACTSET
|
Some points about the valuation charts:
-
Nvidia’s forward P/E of 50.7 compares with valuations of 18.8 for
the S&P 500 and 22.5 for SOXX.
-
SOXX trades at less than half of
Nvidia’s P/E, even though Nvidia makes up 12.3% of the
exchange-traded fund’s portfolio. That highest weighting is
followed by Broadcom Inc. AVGO, at
9.3% of the portfolio and a P/E of 18.9 and Advanced Micro Devices
Inc. AMD, at
7.2% of the portfolio and a P/E of 32.1.
-
Nvidia’s forward P/E of 50.7 is only 2.2 times its forward
price-to-sales ratio of 22.9, emphasizing how profitable its
business is expected to be. In comparison, the S&P 500’s P/E of
18.8 is more than eight times its price/sales ratio of 2.3. For
SOXX, the P/E of 22.5 is 4.4 times its price/sales ratio of 5.1.
We might look back in a few years and conclude that late June of 2023
was still a good time to buy shares of Nvidia, because of its high
profitability and incredible growth trend. But clairvoyance is in
short supply.
SOXX can be a reasonable way to play the AI/semiconductor trend while
avoiding having all your eggs in the Nvidia basket.
Or you may target AI itself, beyond chip makers, by investing in
focused ETFs that take various approaches, including these three:
-
The Global X Robotics & Artificial
Intelligence ETF BOTZ, holds
43 stocks. It tracks an index of companies listed in developed
markets. The companies are expected to benefit from the increased
utilization of robotics and artificial intelligence. The fund is
weighted by market capitalization; its largest holding is Nvidia,
which makes up 12.4% of the portfolio, according to FactSet. It is
the largest AI ETF listed here $2.4 billion in assets under
management. It was established September 2016.
-
The iShares Robotics and Artificial
Intelligence Multisector ETF IRBO, holds
116 stocks that are equal-weighted, as it tracks a global index of
companies that derive at least 50% of revenue from robotics or AI,
or have significant exposure to related industries. This ETF has
$408 million in assets and it was launched in June 2018.
-
The $361 million First Trust Nasdaq
Artificial Intelligence & Robotics ETF ROBT, has
107 stocks in its portfolio, with a modified weighting based on
how directly they are involved in AI or Robotics. It was
established in February 2018.
Semiconductors — ROIC screen
Getting back to chip makers and companies
that manufacture the equipment they use or provide related services,
we began with the SOXX 30 and then added the 30 additional companies
in the S&P 1500 Composite Index in the semiconductor industry, as
determined by FactSet, or in the “Semiconductors and Semiconductor
Equipment” Global Industry Classification Standard (GICS) group. (The
S&P 1500 Composite is made up of the S&P 500, the S&P 400 Mid Cap
Index MID, and
the S&P Small Cap 600 Index SML.)
We then looked back at returns on invested capital for the companies’
past 20 reported fiscal quarters, to calculate five-year averages.
FactSet defines a company’s return on invested capital (ROIC) as
earnings divided by the sum of the carrying value (not the market
value) of a company’s common stock, preferred stock, long-term debt
and capitalized lease obligations.
ROIC is most useful within specific industry groups for a comparison
of how well management teams allocate investors’ money, because some
industries naturally have higher profit margins than others. It isn’t
a perfect measure and it is important to do your own research if a
ROIC number makes a company appear attractive. For example, a
company’s equity capital on its balance sheet may actually be
negative, and this may not be a problem if it is profitable with good
cash flow. But it can distort ROIC.
It turns out that among our 60 semiconductor companies, there are four
for which less than 20 quarters of ROIC data are available.
Among the 56 remaining companies, there are 20 with an average ROIC of
15% (if we round up) or more over the past 20 quarters:
|
Company
|
Ticker
|
Avg. ROIC – past 20 quarters
|
Forward P/E
|
Forward price/ sales
|
Five-year total return
|
Market cap. ($mil)
|
|
Texas Instruments Inc.
|
TXN
|
38.47%
|
22.0
|
8.3
|
71%
|
$152,195
|
|
Lam Research Corp.
|
LRCX
|
33.29%
|
24.6
|
6.0
|
277%
|
$81,781
|
|
KLA Corp.
|
KLAC
|
31.01%
|
23.3
|
7.0
|
368%
|
$62,693
|
|
Applied Materials Inc.
|
AMAT
|
28.46%
|
19.6
|
4.8
|
202%
|
$114,264
|
|
Teradyne Inc.
|
TER
|
28.19%
|
29.3
|
5.6
|
178%
|
$16,304
|
|
Qualcomm Inc.
|
QCOM
|
26.49%
|
12.6
|
3.4
|
121%
|
$126,361
|
|
ASML Holding NV ADR
|
ASML
|
26.05%
|
31.6
|
9.4
|
252%
|
$281,346
|
|
Nvidia Corp.
|
NVDA
|
25.84%
|
50.7
|
22.9
|
579%
|
$1,042,562
|
|
Taiwan Semiconductor Manufacturing Co. Ltd. ADR
|
TSM
|
24.64%
|
18.0
|
6.3
|
202%
|
$528,547
|
|
Advanced Micro Devices Inc.
|
AMD
|
21.99%
|
32.1
|
7.2
|
596%
|
$177,156
|
|
Skyworks Solutions Inc.
|
SWKS
|
21.60%
|
11.7
|
3.4
|
13%
|
$16,237
|
|
Monolithic Power Systems Inc.
|
MPWR
|
20.27%
|
40.5
|
12.4
|
281%
|
$23,996
|
|
Kulicke & Soffa Industries Inc.
|
KLIC
|
18.86%
|
26.1
|
3.6
|
154%
|
$3,154
|
|
Power Integrations Inc.
|
POWI
|
17.87%
|
36.6
|
8.4
|
131%
|
$4,981
|
|
STMicroelectronics NV ADR
|
STM
|
17.72%
|
11.0
|
2.5
|
106%
|
$42,314
|
|
Micron Technology Inc.
|
MU
|
17.45%
|
N/A
|
3.7
|
16%
|
$71,442
|
|
Intel Corp.
|
INTC
|
16.55%
|
32.4
|
2.6
|
-28%
|
$137,643
|
|
Alpha and Omega Semiconductor Ltd.
|
AOSL
|
15.94%
|
22.7
|
1.2
|
97%
|
$822
|
|
Axcelis Technologies Inc.
|
ACLS
|
15.90%
|
24.8
|
5.3
|
724%
|
$5,511
|
|
SolarEdge Technologies Inc.
|
SEDG
|
14.77%
|
21.4
|
3.1
|
387%
|
$13,728
|
|
Source: FactSet
|
Click on the tickers for more about each company, ETF or index.
There is no forward P/E ratio for Micron
Technology Inc. MU because
the sum of analysts’ consensus earnings-per-share estimates for the
company’s next four reported fiscal quarters is negative.
There is some correlation between high ROIC and total returns. Out of
these 20 companies, 16 have beaten the S&P 500’s 72% total return over
the past five years, with dividends reinvested. Meanwhile, 11 of them
have beaten the 176% five-year return for SOXX.
It might surprise you to see Intel Corp. INTC on
the list, with a 16.55% average ROIC. This is the only company that
made the top 20 with a negative five-year total return. Intel is
undergoing an attempted multiyear comeback, including the
creation of a large chip foundry business in the U.S. and other
Western countries.
Keep in mind that ROIC is a useful tool for an initial indicator of
how efficient a company has been at making use of investors’ money. It
is a first step that can point to companies worthy of further research
as part of your effort to find companies likely to remain competitive
providing goods and services over the next decade, at least.
About the Author
 |
Philip van Doorn
Philip van Doorn writes the Deep Dive investing
column for MarketWatch. |
|

Copyright ©2023 MarketWatch, Inc.
|