How to
select oil stocks? Find companies that know how to handle money
Published: May 29, 2018 2:56 p.m.
ET
This
stock screen identifies energy companies — Valero, Phillips 66 and
Marathon, among them — that deploy investors’ money most efficiently
|

Bloomberg
Valero Energy has been a solid performer through the extended
period of low oil prices
|
As
oil prices slumped to less than $30 a barrel in January 2016, many
U.S. producers with heavy debt burdens suddenly found themselves in
serious trouble.
The
result: Earnings turned to losses, and stock prices cratered. And then
came the cost cuts, as companies struggled to dig out from potentially
crippling debt.
But
now, a new set of data shows which U.S.-traded energy companies have
deployed capital most efficiently. (Please see the table below.) The
top companies include Valero Energy Corp.
VLO Phillips 66
PSX and Marathon Petroleum
Corp.
MRO among refiners, and also
Core Laboratories
CLB and Oceaneering
International
OII among oil-services
companies.
Some
companies with high return on corporate capital (ROCC) have seen their
share prices rise more than that of their rivals as well as the S&P
500 Index over the past five years. But the link sometimes isn’t so
clear. (Again, see the table below.) ROCC, incidentally, means net
income plus interest expense and income taxes, divided by the ending
balance of total assets less total liabilities other than
interest-bearing debt.
Even
as West Texas crude
CLN8 has more than doubled to
about $67 a barrel since reaching a low two and a half years ago,
conditions seem ripe for the more efficient oil players. Oil producers
have learned their lesson and worked on cost controls. Credit Suisse
analyst William Featherston said in a report this month that the
average break-even price for the oil exploration and production
companies he covers was $43 a barrel in the fourth quarter, below the
$56 average in early 2015.
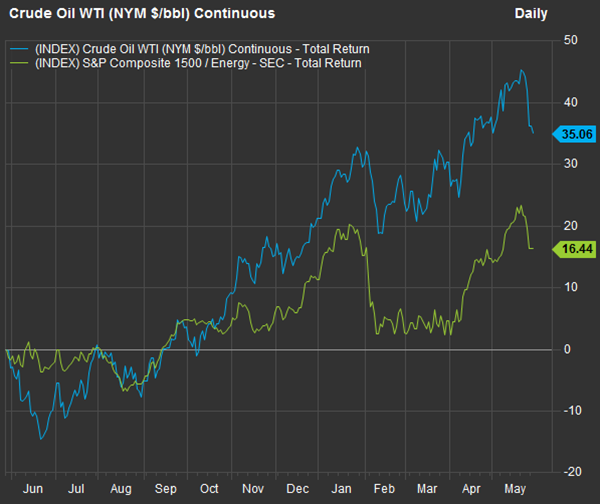
Here’s a one-year chart showing the percentage increase in West Texas
crude prices against the S&P Composite 1500 energy sector’s total
return:
|
FactSet
|
Stock investors are not yet believers in the oil-price recovery.
A
review of the S&P 500 Index energy sector shed light on
oil refiners — the best-performing
industry group through the oil bust and (partial) recovery.
We
then revisited
energy companies with low leverage (debt),
which have for the most part fared well during the recovery.
Now
that the Shareholder Forum has updated its annual return on corporate
capital (ROCC) data, we can look at a large number of energy companies
and compare performance within their reported industry groups.
Return on corporate
capital
Each
company’s ROCC is compared to its industry competitors, based on the
company’s Standard Industrial Classification (SIC), which also comes
from Securities and Exchange Commission annual reports. You can access
ROCC comparisons for U.S.-traded companies
here.
ROCC
is meant to help investors understand how well a company’s management
has used the capital it has raised through selling shares or borrowing
money to produce goods and services for a profit.
Investors can find recovery plays or potential bargain stocks that
might be temporarily undervalued by the market, but concentrating on a
company’s success in its core business relative to competitors is a
better way to limit risk while improving long-term returns overall,
says Gary Lutin of the Shareholder Forum.
A
company’s ROCC is compared to the aggregated assets and income data
for the entire SIC group (of companies publicly traded in the U.S., no
matter their size), excluding for the subject company. This
means that the industry ROCCs for two companies in the same group may
be different.
ROCC
is most meaningful within industries, because some industries require
more investment capital than others.
One
drawback to ROCC is that companies’ reported SIC codes may not always
perfectly match their core businesses, especially if the companies are
conglomerates. So screening stocks by ROCC has its drawbacks, as does
any other initial screening method. But it can help you pare a list
before doing your own research to consider how well a company is
likely to compete over the next decade.
ROCC winners among
energy companies
The
S&P 1500 Composite Index is made up of the S&P 500 Index
SPX the S&P 400 Mid-Cap Index
MID and the S&P Small-Cap
Index
SML There are 89 companies in
the S&P 1500 energy sector, and the Shareholder Forum was able to
gather sufficient data to calculate five-year ROCC averages for 83 of
them. Of that group, 39 have negative average ROCC over the past five
years, leaving us with 44 companies with positive average ROCC.
Of
the remaining 44 energy companies, 23 have five-year average ROCC
higher than the average for their SIC group. Here are all 23, ranked
within each group. The larger groups are listed first, and there are
five SIC groups with only one company represented.
|
Company |
Ticker |
Five-year average ROCC |
Competitors' ROCC |
Standard Industrial Classification (SIC) |
Total return - 2018 through May 25 |
Total return - 12 months |
Total return - 3 years |
Total return - 5 years |
|
Valero Energy
Corp. |
VLO |
12.8% |
7.2% |
Petroleum Refining |
31% |
95% |
118% |
247% |
|
Phillips 66 |
PSX |
12.6% |
7.2% |
Petroleum Refining |
16% |
54% |
56% |
103% |
|
Marathon Petroleum
Corp. |
MPC |
11.8% |
7.2% |
Petroleum Refining |
18% |
51% |
63% |
114% |
|
Andeavor |
ANDV |
10.9% |
7.3% |
Petroleum Refining |
24% |
71% |
68% |
157% |
|
Exxon Mobil Corp. |
XOM |
10.5% |
6.5% |
Petroleum Refining |
-4% |
0% |
2% |
2% |
|
HollyFrontier
Corp. |
HFC |
8.7% |
7.3% |
Petroleum Refining |
44% |
194% |
92% |
90% |
|
PBF Energy Inc.
Class A |
PBF |
7.5% |
7.3% |
Petroleum Refining |
28% |
128% |
85% |
87% |
|
Dril-Quip Inc. |
DRQ |
12.5% |
0.6% |
Oil and Gas Field
Machinery and Equipment |
-4% |
-9% |
-41% |
-50% |
|
Oil States
International Inc. |
OIS |
4.8% |
0.7% |
Oil and Gas Field
Machinery and Equipment |
24% |
22% |
-18% |
-38% |
|
Newpark Resources
Inc. |
NR |
2.1% |
0.9% |
Oil and Gas Field
Machinery and Equipment |
23% |
40% |
18% |
-7% |
|
Baker Hughes, a GE
Co. Class A |
BHGE |
2.0% |
-6.6% |
Oil and Gas Field
Machinery and Equipment |
11% |
-5% |
-18% |
16% |
|
National Oilwell
Varco Inc. |
NOV |
1.7% |
-0.7% |
Oil and Gas Field
Machinery and Equipment |
15% |
27% |
-14% |
-28% |
|
Rowan Cos. Plc
Class A |
RDC |
3.0% |
0.1% |
Drilling Oil and
Gas Wells |
-3% |
22% |
-35% |
-55% |
|
Diamond Offshore
Drilling Inc. |
DO |
1.8% |
0.3% |
Drilling Oil and
Gas Wells |
-5% |
44% |
-45% |
-71% |
|
Noble Corp. PLC |
NE |
1.3% |
0.3% |
Drilling Oil and
Gas Wells |
20% |
29% |
-67% |
-82% |
|
Core Laboratories
NV |
CLB |
40.2% |
2.6% |
Oil and Gas Field
Services, NEC |
13% |
25% |
5% |
-7% |
|
Oceaneering
International Inc. |
OII |
12.2% |
2.5% |
Oil and Gas Field
Services, NEC |
8% |
-6% |
-54% |
-66% |
|
Schlumberger NV |
SLB |
6.4% |
-1.8% |
Oil and Gas Field
Services, NEC |
3% |
2% |
-19% |
3% |
|
Cloud Peak Energy
Inc. |
CLD |
2.9% |
1.2% |
Bituminous Coal
and Lignite Surface Mining |
-29% |
-10% |
-49% |
-84% |
|
Matrix Service Co. |
MTRX |
11.7% |
4.4% |
Construction -
Specisl Trade Contractor |
4% |
127% |
3% |
14% |
|
Oasis Petroleum
Inc. |
OAS |
5.8% |
3.0% |
Crude Petroleum
and Natural Gas |
44% |
17% |
-30% |
-68% |
|
U.S. Silica
Holdings Inc. |
SLCA |
7.6% |
4.9% |
Mining, Quarrying
of Nonmetallic Minerals (No Fuels) |
-5% |
-16% |
0% |
47% |
|
World Fuel
Services Corp. |
INT |
7.8% |
3.8% |
Wholesale -
Petroleum and Petroleum Products (No Bulk Stations) |
-25% |
-42% |
-58% |
-47% |
|
Sources: The
Shareholder Forum, FactSet |
You
can click on the tickers for more information about each company,
including news, estimates, ratings, charts and financials.
The
SIC description for U.S. Silica Holdings
SLCA might be a surprise, but
the company is included in the energy sector because its largest
business segment supplies sand to oil producers that use hydraulic
fracturing.
 |
|
Philip
van Doorn |
|
Philip van Doorn covers various investment and industry topics.
He has previously worked as a senior analyst at TheStreet.com.
He also has experience in community banking and as a credit
analyst at the Federal Home Loan Bank of New York. |
|
Copyright ©2018 MarketWatch, Inc. |