How to
find value amid a boom in U.S. housing stocks
Published: Dec 14, 2017 8:42 a.m.
ET
Shares of home
builders have run ahead of a strong stock market
|

Bloomberg
Contractors raise framed walls in San Jose, Calif. |
No
doubt you’ve seen or heard reports about a housing shortage in the
U.S. While this can make it difficult to buy a home, it can make you
plenty of money as an investor, as long as the trend continues.
Let’s take a broad look at dozens of housing-related stocks to find
value.
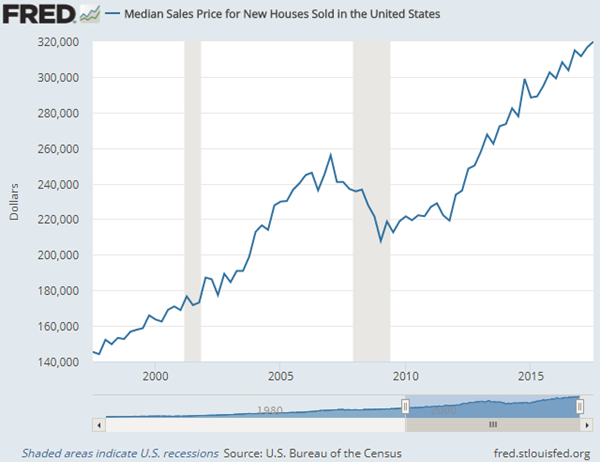
First, the big picture. This chart shows a very healthy market for
sellers of new homes in the past five years, after the housing-market
collapse and the 2008 financial crisis:
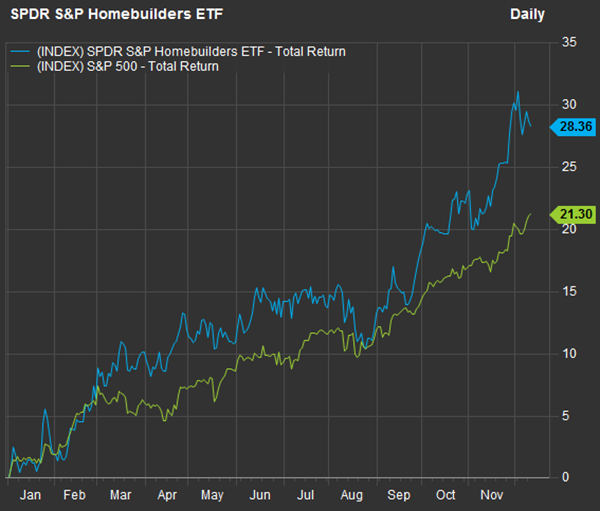
Here’s how the SPDR S&P Homebuilders ETF
XHB has performed this year through Dec. 12 against the S&P 500
Index
SPX:
|
FactSet
|
The
ETF tracks the S&P Homebuilders Select Industry Index, which includes
37 S&P 500 companies that build homes or provide related products or
services.
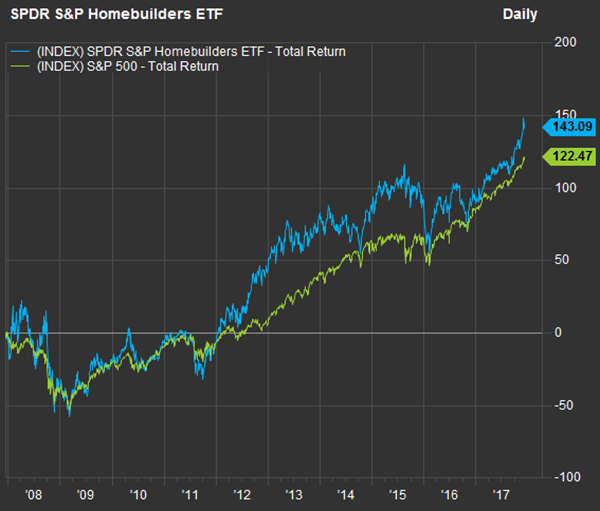
Here’s a 10-year chart comparing the total return of the ETF with the
S&P 500, through Dec. 12:
|
FactSet
|
Of
course, in December 2007, the housing-market collapse had already
started and the forward-looking stock market had already sent shares
of home builders and related companies plunging.
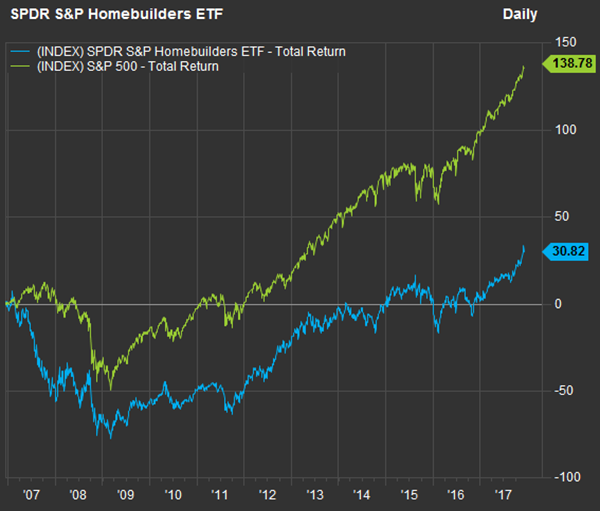
Looking instead at an 11-year chart, the story changes to show a
cyclical industry that can still perform very well over long periods:
|
FactSet
|
Other factors influence the housing market, of course, both nationally
and regionally. There’s no sign of a slowdown for the U.S. economy,
but
the Federal Reserve is slowly and steadily raising short-term rates.
Mortgage loan rates are still very low, but nobody knows how the
tax-reform legislation that may be passed and signed into law by
President Trump as early as next week might affect the housing market.
If
you believe in the long-term strength of U.S. housing and are looking
for a broad long-term investment, you might simply go with the SPDR
S&P Homebuilders ETF and its 36 holdings. Another option is the
iShares U.S. Home Construction ETF
ITB which tracks the Dow Jones U.S. Select Home Construction Index
and has 47 stock holdings. Even so, it is much more heavily
concentrated in stocks of the largest home builders.
The
iShares ETF’s five largest holdings are all home builders, and they
make up 45% of the fund. The fund has returned 54% through Dec. 12.
The SPDR ETF’s top five holdings are four home builders and Home Depot
(No. 5) that together comprise 25% of the fund. That fund has returned
28%, and the S&P 500 has returned 21% this year.
A short-term look at the components of XHB
We
focused our screens on the SPDR S&P Homebuilders ETF. Here are its
components, ranked by how much their sales for the past 12 reported
months (through Dec. 12) increased from the year-earlier 12-month
period:
|
Company
|
Ticker
|
Industry
|
Change in
sales per share - past 12 months from year-earlier 12-month period
|
Gross margin -
past 12 months
|
Gross margin -
year-earlier 12-month period
|
Total return -
2017 through Dec. 12
|
|
LGI Homes Inc. |
LGIH |
Homebuilding |
29% |
26.25% |
26.24% |
146% |
|
Installed
Building Products Inc. |
IBP |
Building Products |
29% |
27.01% |
27.81% |
69% |
|
PulteGroup Inc. |
PHM |
Homebuilding |
28% |
22.55% |
21.56% |
86% |
|
William Lyon
Homes Class A |
WLH |
Homebuilding |
24% |
17.28% |
17.99% |
48% |
|
Century
Communities Inc. |
CCS |
Homebuilding |
20% |
18.39% |
20.13% |
40% |
|
iRobot Corp. |
IRBT |
Electronics/
Appliances |
19% |
50.20% |
47.39% |
20% |
|
M.D.C. Holdings
Inc. |
MDC |
Homebuilding |
17% |
16.69% |
16.53% |
35% |
|
Toll Brothers
Inc. |
TOL |
Homebuilding |
17% |
21.60% |
19.84% |
53% |
|
Lowe’s Cos. |
LOW |
Home Improvement
chains |
16% |
32.16% |
32.26% |
22% |
|
Lennar Corp.
Class B |
LEN.B |
Homebuilding |
16% |
21.44% |
22.09% |
46% |
|
Lennar Corp.
Class A |
LEN |
Homebuilding |
16% |
21.44% |
22.09% |
46% |
|
D.R. Horton Inc. |
DHI |
Homebuilding |
15% |
21.63% |
21.84% |
85% |
|
Taylor Morrison
Home Corp. Class A |
TMHC |
Homebuilding |
14% |
18.70% |
19.39% |
21% |
|
Owens Corning |
OC |
Construction
Materials |
14% |
24.78% |
24.75% |
70% |
|
A.O. Smith Corp. |
AOS |
Building Products |
13% |
41.10% |
41.58% |
30% |
|
M/I Homes Inc. |
MHO |
Homebuilding |
12% |
20.96% |
22.47% |
36% |
|
Lennox
International Inc. |
LII |
Building Products |
11% |
29.33% |
29.23% |
36% |
|
Home Depot Inc. |
HD |
Home Improvement
Chains |
11% |
32.28% |
32.32% |
39% |
|
CalAtlantic Group
Inc. |
CAA |
Homebuilding |
11% |
21.24% |
22.04% |
62% |
|
TopBuild Corp. |
BLD |
Building Products |
10% |
24.02% |
23.17% |
83% |
|
NVR Inc. |
NVR |
Homebuilding |
10% |
19.47% |
19.43% |
102% |
|
Cavco Industries
Inc. |
CVCO |
Homebuilding |
10% |
22.39% |
22.20% |
40% |
|
Bed Bath & Beyond
Inc. |
BBBY |
Specialty Stores |
9% |
37.02% |
37.83% |
-42% |
|
Fortune Brands
Home & Security Inc. |
FBHS |
Building Products |
8% |
36.17% |
35.29% |
27% |
|
Allegion PLC |
ALLE |
Building Products |
7% |
43.85% |
43.93% |
29% |
|
Masco Corp. |
MAS |
Building Products |
7% |
34.11% |
32.96% |
35% |
|
Whirlpool Corp. |
WHR |
Electronics/
Appliances |
6% |
16.48% |
17.82% |
-6% |
|
Mohawk Industries
Inc. |
MHK |
Home Furnishings |
6% |
31.93% |
31.75% |
38% |
|
Williams-Sonoma
Inc. |
WSM |
Specialty Stores |
6% |
36.73% |
36.73% |
8% |
|
Leggett & Platt
Inc. |
LEG |
Home Furnishings |
4% |
22.20% |
24.14% |
-3% |
|
Helen of Troy
Ltd. |
HELE |
Electronics/
Appliances |
4% |
43.90% |
42.73% |
8% |
|
Aaron’s Inc. |
AAN |
Finance/ Rental/
Leasing |
3% |
47.03% |
47.45% |
13% |
|
Tempur Sealy
International Inc. |
TPX |
Home Furnishings |
2% |
41.72% |
41.72% |
-11% |
|
Johnson Controls
International PLC |
JCI |
Misc. Commercial
Services |
2% |
30.85% |
25.01% |
-5% |
|
Tri Pointe Group
Inc. |
TPH |
Homebuilding |
1% |
21.48% |
23.60% |
52% |
|
USG Corp. |
USG |
Construction
Materials |
-15% |
20.86% |
23.13% |
28% |
|
Source: FactSet |
You
can click the tickers for more information on each company, including
news, price ratios, financials and filings.
We
are showing sales per share, rather than raw revenue, because the
per-share figures incorporate any dilution from the issuance of new
shares for any reason (including to pay for acquisitions) as well as
any decline in the share count brought about by stock buybacks.
A
company’s gross profit margin is sales, less the cost of goods or
services sold, divided by sales. It is a measure of profitability for
the core business and reflects pricing power. A declining margin might
mean that a company has been forced to offer more discounts to defend
its market share or to increase sales.
Here’s the list again, in the same order, with summaries of the
opinions of sell-side analysts polled by FactSet:
|
Company
|
Ticker
|
Share ‘buy’
ratings
|
Share neutral
ratings
|
Share ‘sell’
ratings
|
Closing price
- Dec. 12
|
Consensus
price target |
implied
12-month upside potential
|
|
LGI Homes Inc. |
LGIH |
33% |
67% |
0% |
$70.73 |
$65.60 |
-7% |
|
Installed
Building Products Inc. |
IBP |
75% |
25% |
0% |
$69.80 |
$73.86 |
6% |
|
PulteGroup Inc. |
PHM |
36% |
59% |
5% |
$33.69 |
$30.97 |
-8% |
|
William Lyon
Homes Class A |
WLH |
40% |
60% |
0% |
$28.25 |
$30.88 |
8% |
|
Century
Communities Inc. |
CCS |
100% |
0% |
0% |
$29.50 |
$33.80 |
15% |
|
iRobot Corp. |
IRBT |
22% |
67% |
11% |
$70.40 |
$72.60 |
3% |
|
M.D.C. Holdings
Inc. |
MDC |
0% |
64% |
36% |
$31.17 |
$28.39 |
-9% |
|
Toll Brothers
Inc. |
TOL |
48% |
48% |
4% |
$47.09 |
$48.86 |
4% |
|
Lowe’s Cos. |
LOW |
53% |
44% |
3% |
$84.99 |
$88.10 |
4% |
|
Lennar Corp.
Class B |
LEN.B |
52% |
48% |
0% |
$49.29 |
$61.54 |
25% |
|
Lennar Corp.
Class A |
LEN |
52% |
48% |
0% |
$61.43 |
$61.54 |
0% |
|
D.R. Horton Inc. |
DHI |
52% |
48% |
0% |
$50.00 |
$49.05 |
-2% |
|
Taylor Morrison
Home Corp. Class A |
TMHC |
8% |
92% |
0% |
$23.35 |
$24.75 |
6% |
|
Owens Corning |
OC |
64% |
36% |
0% |
$86.98 |
$90.35 |
4% |
|
A.O. Smith Corp. |
AOS |
43% |
57% |
0% |
$61.06 |
$64.29 |
5% |
|
M/I Homes Inc. |
MHO |
100% |
0% |
0% |
$34.26 |
$36.50 |
7% |
|
Lennox
International Inc. |
LII |
24% |
76% |
0% |
$206.68 |
$193.33 |
-6% |
|
Home Depot Inc. |
HD |
71% |
29% |
0% |
$181.80 |
$188.09 |
3% |
|
CalAtlantic Group
Inc. |
CAA |
7% |
93% |
0% |
$54.75 |
$49.05 |
-10% |
|
TopBuild Corp. |
BLD |
71% |
29% |
0% |
$65.24 |
$73.14 |
12% |
|
NVR Inc. |
NVR |
11% |
78% |
11% |
$3,368.97 |
$3,231.00 |
-4% |
|
Cavco Industries
Inc. |
CVCO |
100% |
0% |
0% |
$140.00 |
$164.00 |
17% |
|
Bed Bath & Beyond
Inc. |
BBBY |
4% |
71% |
25% |
$23.18 |
$22.83 |
-1% |
|
Fortune Brands
Home & Security Inc. |
FBHS |
50% |
50% |
0% |
$67.23 |
$71.21 |
6% |
|
Allegion PLC |
ALLE |
55% |
45% |
0% |
$82.15 |
$89.78 |
9% |
|
Masco Corp. |
MAS |
68% |
32% |
0% |
$42.19 |
$44.63 |
6% |
|
Whirlpool Corp. |
WHR |
36% |
64% |
0% |
$166.51 |
$187.13 |
12% |
|
Mohawk Industries
Inc. |
MHK |
78% |
22% |
0% |
$275.34 |
$294.84 |
7% |
|
Williams-Sonoma
Inc. |
WSM |
14% |
64% |
22% |
$50.90 |
$49.57 |
-3% |
|
Leggett & Platt
Inc. |
LEG |
44% |
56% |
0% |
$46.33 |
$54.86 |
18% |
|
Helen of Troy
Ltd. |
HELE |
60% |
20% |
20% |
$90.90 |
$104.25 |
15% |
|
Aaron’s Inc. |
AAN |
82% |
18% |
0% |
$36.02 |
$47.14 |
31% |
|
Tempur Sealy
International Inc. |
TPX |
36% |
55% |
9% |
$61.00 |
$66.14 |
8% |
|
Johnson Controls
International PLC |
JCI |
37% |
58% |
5% |
$38.25 |
$44.29 |
16% |
|
Tri Pointe Group
Inc. |
TPH |
58% |
42% |
0% |
$17.42 |
$17.95 |
3% |
|
USG Corp. |
USG |
10% |
76% |
14% |
$36.92 |
$33.71 |
-9% |
|
Source: FactSet |
While there are majority “buy” or equivalent ratings for 18 out of the
ETF’s 36 components, the analysts’ price targets for most of them
aren’t particularly aggressive.
A longer-term look
The
first table showed sales per share and gross margin. It’s good if both
are going up, of course, but these figures don’t incorporate other
expenses or other problems companies face.
There’s a new tool that you can use to make useful comparisons of
companies to their industry competitors. It’s called return on
corporate capital (ROCC) and was recently developed by the Shareholder
Forum to help individual investors screen companies for quality.
The
calculation is similar to return on invested capital (ROIC), but there
are some differences. There’s no strict definition for ROIC. ROCC is
calculated the same way for every company that’s publicly traded in
the U.S., using annual data filed with the Securities and Exchange
Commission: Net income plus interest expense and income taxes, divided
by the ending balance of total assets less current liabilities other
than interest-bearing debt.
The
idea is to measure how good a company’s management is at investing the
money it raises or borrows. Each company’s ROCC is compared to its
industry competitors, based on the company’s Standard Industrial
Classification (SIC), which also comes from SEC filings. In other
words, the subject company’s numbers are excluded from those of its
industry SIC group when the comparison is made. The comparisons are
available here for free.
ROCC
comparisons are most meaningful within industries. Banks, for example,
tend to have lower ROCC than many other industries because it is their
business to leverage capital by gathering deposits and borrowing
money.
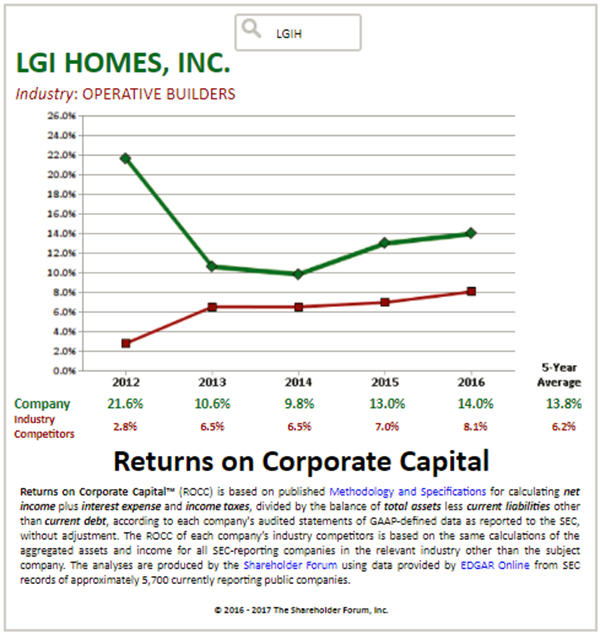
Here’s a sample comparison of LGI Homes Inc.
LGIH to its SIC industry group:
|
The Shareholder Forum
|
You
can see that the company’s average ROCC for five years has been well
above that of its industry competitors, and that the numbers have been
sloping upward over the past two years.
Here
are the components of the SPDR S&P Homebuilders ETF again, in the same
order, with average ROCC comparisons to their industry groups.
|
Company
|
Ticker
|
Five-year
average ROCC
|
Five-year
average ROCC for SIC group
|
SIC group
|
|
LGI Homes Inc. |
LGIH |
13.8% |
6.2% |
Operative
Builders |
|
Installed
Building Products Inc. |
IBP |
11.8% |
7.4% |
General Building
Contractors - Residential Buildings |
|
PulteGroup Inc. |
PHM |
7.0% |
6.1% |
Operative
Builders |
|
William Lyon
Homes Class A |
WLH |
4.4% |
6.3% |
Operative
Builders |
|
Century
Communities Inc. |
CCS |
6.8% |
7.1% |
Operative
Builders |
|
iRobot Corp. |
IRBT |
12.5% |
10.4% |
Household
Appliances |
|
M.D.C. Holdings
Inc. |
MDC |
4.6% |
6.3% |
Operative
Builders |
|
Toll Brothers
Inc. |
TOL |
4.7% |
6.4% |
Operative
Builders |
|
Lowe’s Cos. |
LOW |
15.5% |
29.2% |
Retail - Lumber
and Other Materials Dealers |
|
Lennar Corp.
Class B |
LEN.B |
7.0% |
9.1% |
General Building
Contractors - Residential Buildings |
|
Lennar Corp.
Class A |
LEN |
7.0% |
9.1% |
General Building
Contractors - Residential Buildings |
|
D.R. Horton Inc. |
DHI |
11.1% |
5.2% |
Operative
Builders |
|
Taylor Morrison
Home Corp. Class A |
TMHC |
0.3% |
6.6% |
Operative
Builders |
|
Owens Corning |
OC |
6.1% |
0.7% |
Abrasive Asbestos
and Misc. Nonmetallic Mineral Products |
|
A.O. Smith Corp. |
AOS |
16.9% |
9.5% |
Household
Appliances |
|
M/I Homes Inc. |
MHO |
6.0% |
6.2% |
Operative
Builders |
|
Lennox
International Inc. |
LII |
27.1% |
18.9% |
Air Conditioning
and Warm Air Heating Equipment and Commercial and Industrial
Refrigeration Equipment |
|
Home Depot Inc. |
HD |
31.0% |
14.6% |
Retail - Lumber
and Other Materials Dealers |
|
CalAtlantic Group
Inc. |
CAA |
6.1% |
6.2% |
Operative
Builders |
|
TopBuild Corp. |
BLD |
6.1% |
3.1% |
Construction
Special Trade Contractors |
|
NVR Inc. |
NVR |
19.9% |
5.6% |
Operative
builders |
|
Cavco Industries
Inc. |
CVCO |
8.3% |
N/A |
Mobile Homes |
|
Bed Bath & Beyond
Inc. |
BBBY |
32.8% |
19.0% |
Retail - Home
Furniture, Furnishing and Equipment Stores |
|
Fortune Brands
Home & Security Inc. |
FBHS |
10.0% |
6.7% |
General Building
Contractors - Residential Buildings |
|
Allegion PLC |
ALLE |
17.9% |
-34.4% |
Detective, Guard
and Armored Car Services |
|
Masco Corp. |
MAS |
15.4% |
4.8% |
Millwood, Veneer,
Plywood and Structural Wood Members |
|
Whirlpool Corp. |
WHR |
9.5% |
14.5% |
Household
Appliances |
|
Mohawk Industries
Inc. |
MHK |
9.7% |
N/A |
Carpets and Rugs |
|
Williams-Sonoma
Inc. |
WSM |
30.4% |
26.5% |
Retail - Home
Furniture, Furnishing and Equipment Stores |
|
Leggett & Platt
Inc. |
LEG |
15.8% |
14.6% |
Household
Furniture |
|
Helen of Troy
Ltd. |
HELE |
10.3% |
N/A |
Electric
Housewares and Fans |
|
Aaron’s Inc. |
AAN |
13.8% |
7.2% |
Services -
Equipment Rental and Leasing |
|
Tempur Sealy
International Inc. |
TPX |
15.2% |
15.1% |
Household
Furniture |
|
Johnson Controls
International PLC |
JCI |
11.4% |
8.4% |
Misc. Business
Services |
|
Tri Pointe Group
Inc. |
TPH |
11.4% |
6.3% |
Operative
Builders |
|
USG Corp. |
USG |
9.5% |
5.8% |
Concrete, Gypsum
and Plaster Products |
|
Source: The
Shareholder Forum |
If
fewer than five years of data is available for a company, the average
ROCC used for the comparisons in the table is for the number of full
years of data available. If there is no average ROCC number available
for a company’s competitors, it means there are fewer than four other
publicly traded companies within that SIC group.
You
can review more detailed ROCC data for each company
here.
 |
|
Philip
van Doorn |
|
Philip van Doorn covers various investment and industry topics.
He has previously worked as a senior analyst at TheStreet.com.
He also has experience in community banking and as a credit
analyst at the Federal Home Loan Bank of New York. |
|
Copyright ©2017 MarketWatch, Inc. |