Opinion:
Here’s a better way to screen for dividend stocks so you don’t get
burned
Published: Nov 28, 2017 4:06 a.m. ET
A dividend cut is an
income investor’s worst nightmare
|
Bloomberg News
Seagate Technology has reported plenty of free cash flow to
support a higher dividend payout. |
As
U.S. equity markets hit record highs, stocks with high dividend yields
remain popular, despite the Federal Reserve’s inclination to raise
official interest rates.
There are several ways to screen dividend-paying companies, and we’ll
share two of them here, while listing the 35 highest-yielding stocks
in the S&P 500 Index
SPX.
Dreading dividend
cuts
One
of the riskiest aspects of dividend stocks is the prospect of a
dividend cut. If investors expect the dividend to decline, the stock
price is almost certain to plunge, which will push the yield higher
until the cut is announced.
S&P
Dow Jones Indices maintains a list of roughly 50
S&P 500 Dividend Aristocrats,
which are companies included in that benchmark index that have
increased their regular dividend payments for at least 25 consecutive
years. However, many Dividend Aristocrat stocks have low yields.
Any
analysis of a company’s financial performance is backward looking, so
there can never be a guarantee that you won’t suffer a dividend cut.
However, we can present data that will provide comfort or at least
some warnings.
ROCC
Using data provided by FactSet, we looked at the 35 S&P 500
SPX stocks
with the highest dividend yields. We’re going to list them twice
(three times for real estate investment trusts).
First, we will show how the companies have performed against industry
competitors, as measured by their returns on corporate capital (ROCC).
ROCC
was recently developed by the Shareholder Forum. The calculation is
similar to return on invested capital (ROIC), but there are some
differences. Definitions of ROIC vary. ROCC is calculated the same way
for every company that’s publicly traded in the U.S., using annual
data filed with the Securities and Exchange Commission: Net income
plus interest expense and income taxes, divided by the ending balance
of total assets less total liabilities other than interest-bearing
debt.
The
idea is to measure how good a company’s management is at investing the
money it raises or borrows. Each company’s ROCC is compared to its
industry competitors, based on the company’s Standard Industrial
Classification (SIC), which also comes from SEC filings. Those
comparisons are available for free
here.
So a
company’s ROCC is not simply compared to the average ROCC for its SIC
group. Instead, a calculation is made for the aggregated assets and
income data for the entire SIC group, excluding for the subject
company. This means that the industry ROCCs for two companies in
the same group may be different.
ROCC
is most meaningful within industries. Banks, for example, tend to have
lower ROCC than many other industries because it is their business to
leverage capital by gathering deposits and borrowing money.
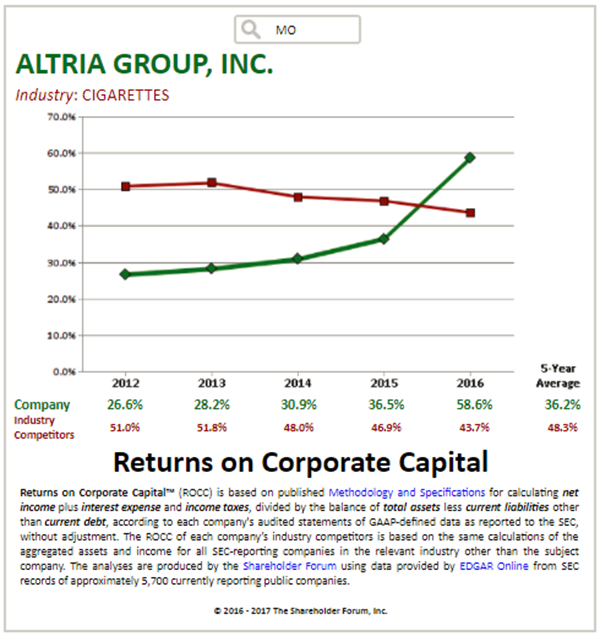
You
can get quite a bit of insight if you compare a company’s ROCC to its
industry competitors. For example, the five-year ROCC trend for Altria
Group Inc.
MO is
up, while the trend for its competitors in the cigarettes SIC group is
down:
|
The
Shareholder Forum |
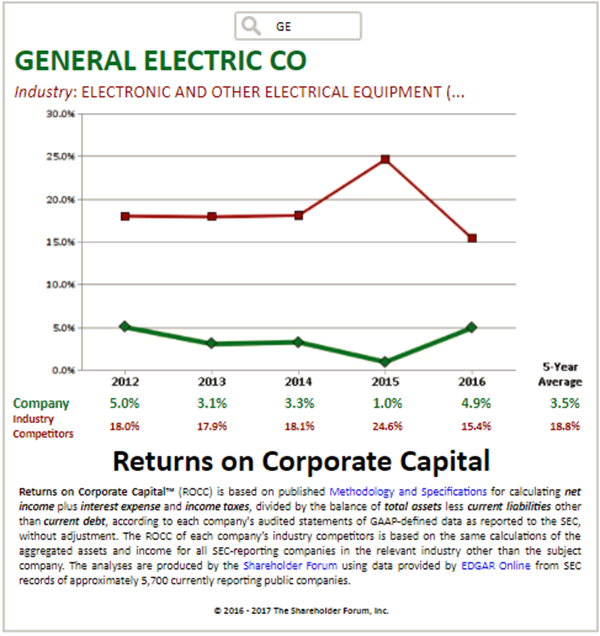
If
the ROCC trend curve for a company you are interested in is heading
south, something may be very wrong, and you had better do additional
research to find out what is going on.
On
Nov. 13, General Electric Co.
GE said
it would cut its dividend in half.
That was not a surprise for investors, as company CEO John Flannery
had said the dividend policy was under review as part of an effort to
shore up cash.
Check out GE’s ROCC trend against that of its industry group:
|
The
Shareholder Forum |
The
ROCC indicated that GE’s management just wasn’t getting it done.
Here
are the 35 S&P 500 stocks with the highest yields, with five-year
average ROCC comparisons and indications of whether the companies have
cut their dividend payments at any time over the past five or 10
years:
|
Company
|
Ticker
|
Dividend
yield - Nov. 24
|
SIC group
|
Average ROCC
|
Average ROCC
for industry competitors
|
Dividend cut
over past five years?
|
Dividend cut
over past 10 years?
|
|
CenturyLink
Inc. |
CTL |
15.61% |
Telephone
Communications (No Radio Telephone) |
5.0% |
7.3% |
Yes |
Yes |
|
Macy’s Inc. |
M |
7.17% |
Retail -
Department Stores |
15.3% |
2.2% |
No |
Yes |
|
Seagate
Technology PLC |
STX |
6.25% |
Computer
Storage Devices |
27.8% |
9.9% |
No |
Yes |
|
Kimco Realty
Corp. |
KIM |
5.96% |
Real Estate
Investment Trusts |
7.3% |
3.9% |
No |
Yes |
|
Scana Corp. |
SCG |
5.85% |
Electric and
Other Services Combined |
7.4% |
5.0% |
No |
No |
|
Oneok Inc. |
OKE |
5.84% |
Natural Gas
Transmission and Distribution |
5.7% |
6.7% |
No |
No |
|
Iron Mountain
Inc. |
IRM |
5.67% |
Real Estate
Investment Trusts |
7.6% |
3.9% |
No |
No |
|
AT&T Inc. |
T |
5.63% |
Telephone
Communications (No Radio Telephone) |
7.4% |
6.3% |
No |
No |
|
HCP Inc. |
HCP |
5.51% |
Real Estate
Investment Trusts |
7.7% |
3.9% |
Yes |
Yes |
|
Navient Corp. |
NAVI |
5.19% |
Security
Brokers, Dealers & Floatation Companies |
1.1% |
1.1% |
No |
No |
|
Welltower Inc. |
HCN |
5.10% |
Real Estate
Investment Trusts |
4.1% |
4.0% |
No |
No |
|
Verizon
Communications Inc. |
VZ |
5.02% |
Telephone
Communications (No Radio Telephone) |
8.9% |
5.8% |
No |
No |
|
Helmerich &
Payne Inc. |
HP |
5.00% |
Drilling Oil
and Gas Wells |
12.6% |
1.5% |
No |
No |
|
L Brands Inc. |
LB |
4.96% |
Retail -
Women’s Clothing Stores |
33.4% |
11.1% |
No |
No |
|
Ford Motor Co. |
F |
4.96% |
Motor Vehicles
and Passenger Car Bodies |
4.8% |
0.6% |
No |
No |
|
Kohl’s Corp. |
KSS |
4.88% |
Retail -
Department Stores |
15.4% |
3.6% |
No |
No |
|
Ventas Inc. |
VTR |
4.79% |
Real Estate
Investment Trusts |
5.4% |
3.9% |
Yes |
Yes |
|
Macerich Co. |
MAC |
4.61% |
Real Estate
Investment Trusts |
7.6% |
3.9% |
No |
Yes |
|
Simon Property
Group Inc. |
SPG |
4.53% |
Real Estate
Investment Trusts |
8.1% |
3.9% |
No |
Yes |
|
Southern Co. |
SO |
4.51% |
Electric
Services |
6.0% |
4.8% |
No |
No |
|
Realty Income
Corp. |
O |
4.51% |
Real Estate
Investment Trusts |
4.5% |
4.0% |
No |
No |
|
Occidental
Petroleum Corp. |
OXY |
4.50% |
Crude Petroleum
& Natural Gas |
1.3% |
-5.8% |
No |
No |
|
AES Corp. |
AES |
4.49% |
Cogeneration
Services and Small Power Producers |
4.8% |
N/A |
No |
No |
|
Target Corp. |
TGT |
4.44% |
Retail -
Variety Stores |
12.8% |
18.4% |
No |
No |
|
PPL Corp. |
PPL |
4.35% |
Electric
Services |
7.1% |
4.8% |
No |
No |
|
Williams Cos. |
WMB |
4.28% |
Natural Gas
Transmission |
4.6% |
4.2% |
Yes |
Yes |
|
FirstEnergy
Corp. |
FE |
4.24% |
Electric
Services |
-1.2% |
5.2% |
Yes |
Yes |
|
Entergy Corp. |
ETR |
4.17% |
Electric
Services |
2.1% |
5.0% |
No |
No |
|
Philip Morris
International Inc. |
PM |
4.15% |
Cigarettes |
50.1% |
35.2% |
No |
No |
|
Host Hotels &
Resorts Inc. |
HST |
4.04% |
Real Estate
Investment Trusts |
6.6% |
3.9% |
No |
Yes |
|
Altria Group
Inc. |
MO |
4.03% |
Cigarettes |
36.2% |
48.3% |
No |
Yes |
|
Duke Energy
Corp. |
DUK |
4.01% |
Electric and
Other Services Combined |
4.3% |
5.2% |
No |
No |
|
International
Business Machines Corp. |
IBM |
3.95% |
Computer and
Office Equipment |
20.6% |
4.0% |
No |
No |
|
PG&E Corp. |
PCG |
3.92% |
Electric and
Other Services Combined |
3.7% |
5.2% |
No |
No |
|
Interpublic
Group of Cos. |
IPG |
3.84% |
Services -
Advertising Agencies |
14.3% |
13.0% |
No |
No |
|
Sources:
FactSet, Shareholder Forum |
Note: We’re indicating whether a company has cut its dividend over the
past five or 10 years. However, but this does not mean a company
didn’t initiate a regular dividend payout during either of
these periods.
CenturyLink
CTL is
the highest-yielding S&P 500 stock. A yield of 15.61% makes it very
clear that many investors expect the company to cut its dividend. The
company last cut its dividend on Feb. 13, 2013, when it announced
a 26% reduction in the regular payout on
the same day it unveiled a $2 billion buyback. That was
quite a smack in the face for investors who were relying on the
dividend income. The stock dropped 23% the following day.
During the company’s most recent earnings conference call with
analysts on Nov. 8, CenturyLink CEO Glen Post said: “We realize the
dividend is an attractive part of our shareholder return, and we are
confident we can continue to pay the dividend while investing in
growth and in our network and as we de-lever our balance sheet.”
A
dividend cut that happened many years ago may not indicate that a
company’s current payout is threatened. An example is Altria, which
cut its dividend in 2008 after Kraft and Philip Morris International
Inc. were spun off, so that shareholders of the former parent and
spun-off companies would initially receive the same aggregate payouts.
A
shorter-term approach: free cash flow yield
Leaving long-term performance aside, a company’s free cash flow yield
can indicate whether it can comfortably continue to pay its current
dividend or raise the dividend. Free cash flow is remaining cash flow
after planned capital expenditures. It is money that can be used to
raise the dividend, repurchase shares, expand through acquisitions,
reinvest in plants and equipment, or do other things to grow the
business organically.
We
can calculate a company’s free cash flow yield by dividing its free
cash flow per share over the past 12 months by the current share
price. If we then compare the free cash flow yield to the current
dividend yield, we can see if the company has “headroom” to increase
the dividend.
If
we look again at GE, we can see that as of the market close on Nov.
10, before the dividend cut was announced, the dividend yield was
4.69%. The company’s free cash flow yield over the previous 12 months
was minus 1.27%. Its free cash flow per share was negative
during three of the past four reported quarters.
If a
company’s 12-month free cash flow yield is lower than its dividend
yield, it does not necessarily mean a dividend cut is coming. The
company may have made an important acquisition using a lot of cash,
skewing the results for a year. Or there could be other good reasons
for a temporary reduction in cash flow. But you had better find out.
For
real estate investment trusts, a non-GAAP measure called funds from
operations (FFO) is typically used by investors to gauge
dividend-paying ability. FFO adds depreciation and amortization back
to earnings, while subtracting gains on property sales. In the next
table, we will show the same group of highest-yielding S&P 500 stocks
with free cash flow yields based on GAAP. This will be followed by an
FFO yield table for the REITs.
Here
are free cash flow yield comparisons for the 35 highest-yielding S&P
500 stocks:
|
Company
|
Ticker
|
Dividend
yield - Nov. 24
|
Free cash
flow yield - past 12 reported months |
‘Headroom’
|
|
CenturyLink
Inc. |
CTL |
15.61% |
6.16% |
-9.45% |
|
Macy’s Inc. |
M |
7.17% |
21.34% |
14.17% |
|
Seagate
Technology PLC |
STX |
6.25% |
9.72% |
3.47% |
|
Kimco Realty
Corp. (REIT) |
KIM |
5.96% |
3.93% |
-2.03% |
|
Scana Corp. |
SCG |
5.85% |
-2.61% |
N/A |
|
Oneok Inc. |
OKE |
5.84% |
5.05% |
-0.79% |
|
Iron Mountain
Inc. (REIT) |
IRM |
5.67% |
2.85% |
-2.82% |
|
AT&T Inc. |
T |
5.63% |
7.66% |
2.03% |
|
HCP Inc. (REIT) |
HCP |
5.51% |
6.11% |
0.60% |
|
Navient Corp. |
NAVI |
5.19% |
33.92% |
28.73% |
|
Welltower Inc.
(REIT) |
HCN |
5.10% |
3.00% |
-2.10% |
|
Verizon
Communications Inc. |
VZ |
5.02% |
2.79% |
-2.23% |
|
Helmerich &
Payne Inc. |
HP |
5.00% |
-0.67% |
N/A |
|
L Brands Inc. |
LB |
4.96% |
6.06% |
1.10% |
|
Ford Motor Co. |
F |
4.96% |
22.19% |
17.23% |
|
Kohl’s Corp. |
KSS |
4.88% |
13.53% |
8.65% |
|
Ventas Inc. (REIT) |
VTR |
4.79% |
6.02% |
1.23% |
|
Macerich Co. (REIT) |
MAC |
4.61% |
4.96% |
0.35% |
|
Simon Property
Group Inc. (REIT) |
SPG |
4.53% |
6.60% |
2.07% |
|
Southern Co. |
SO |
4.51% |
-3.30% |
N/A |
|
Realty Income
Corp. (REIT) |
O |
4.51% |
5.43% |
0.92% |
|
Occidental
Petroleum Corp. |
OXY |
4.50% |
2.25% |
-2.25% |
|
AES Corp. |
AES |
4.49% |
3.23% |
-1.26% |
|
Target Corp. |
TGT |
4.44% |
15.13% |
10.69% |
|
PPL Corp. |
PPL |
4.35% |
-2.34% |
N/A |
|
Williams Cos. |
WMB |
4.28% |
7.49% |
3.21% |
|
FirstEnergy
Corp. |
FE |
4.24% |
5.51% |
1.27% |
|
Entergy Corp. |
ETR |
4.17% |
-8.57% |
N/A |
|
Philip Morris
International Inc. |
PM |
4.15% |
4.18% |
0.03% |
|
Host Hotels &
Resorts Inc. (REIT) |
HST |
4.04% |
6.34% |
2.30% |
|
Altria Group
Inc. |
MO |
4.03% |
3.38% |
-0.65% |
|
Duke Energy
Corp. |
DUK |
4.01% |
-3.67% |
N/A |
|
International
Business Machines Corp. |
IBM |
3.95% |
8.05% |
4.10% |
|
PG&E Corp. |
PCG |
3.92% |
1.36% |
-2.56% |
|
Interpublic
Group of Cos. |
IPG |
3.84% |
2.88% |
-0.96% |
|
Sources:
FactSet, Shareholder Forum |
Note: For L Brands Inc.
LB free
cash flow figures for the quarter ended Oct. 28 are not yet available,
so the free cash flow yield calculation is for the four quarters ended
July 29.
Here
are the REITs with FFO yield comparisons, as explained above the
previous table:
|
Company
|
Ticker
|
Dividend
yield - Nov. 24
|
FFO yield -
past 12 reported months |
‘Headroom’
|
|
Kimco Realty
Corp. |
KIM |
5.96% |
8.24% |
2.28% |
|
Iron Mountain
Inc. |
IRM |
5.67% |
5.02% |
-0.65% |
|
HCP Inc. |
HCP |
5.51% |
7.66% |
2.15% |
|
Welltower Inc. |
HCN |
5.10% |
6.28% |
1.18% |
|
Ventas Inc. |
VTR |
4.79% |
6.43% |
1.64% |
|
Macerich Co. |
MAC |
4.61% |
6.19% |
1.58% |
|
Simon Property
Group Inc. |
SPG |
4.53% |
6.73% |
2.20% |
|
Realty Income
Corp. |
O |
4.51% |
5.32% |
0.81% |
|
Host Hotels &
Resorts Inc. |
HST |
4.04% |
8.43% |
4.39% |
|
Sources:
FactSet, Shareholder Forum |
No
screening method for stocks can be perfect. But long-term and
short-term information, combined with your own research and opinion
about a company’s products and business strategy, can help you pick
solid stocks for income.
 |
|
Philip
van Doorn |
|
Philip van Doorn covers various investment and industry topics.
He has previously worked as a senior analyst at TheStreet.com.
He also has experience in community banking and as a credit
analyst at the Federal Home Loan Bank of New York. |
|
Copyright ©2017 MarketWatch, Inc. |