|
Opinion:
How to pick stocks that will outperform for the next 20 years
Published: Nov 10, 2015
7:59 a.m. ET
Find companies with worthy products or services and a high return on
invested capital
|
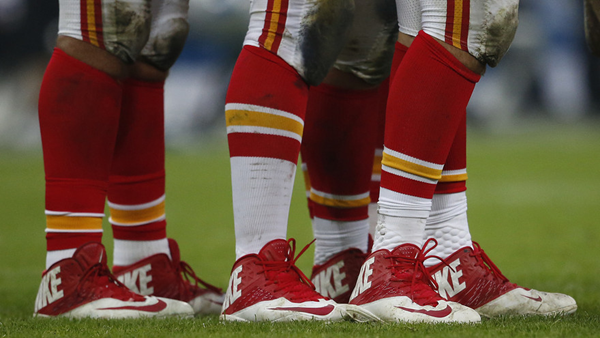
Getty Images
There were plenty of
Nike shoes on the field when the Kansas City Chiefs played the
Detroit Lions at Wembley Stadium in London on Nov. 1. Nike’s stock has had a remarkable
multi-decade run, soaring almost 47,000% in 30 years.
|
Is it possible for investors to pick winning stocks on
their own?
The
investment-advisory and money-management industry says you can’t — it’s
too complicated. But an adviser or manager could do it for you, of course.
As many
mutual funds have relatively high management fees, you might be
well-served by holding a few individual stocks in your retirement
portfolio. That may seem like a radical idea, in light of all the advice
not to do so, but some 401(k) plans are actually being changed to allow
you to make your own investment choices within brokerage accounts.
In July,
as part of MarketWatch’s
Fixing the Market series, I
discussed the long-term rise in stock-based executive compensation,
whether it was a good thing and what investors might do to curb it. Gary
Lutin, a former investment banker at Lutin & Co. who oversees the
Shareholder Forum in New York, said at the time that investors seeking to
hold shares of individual companies need to find ones that are likely to
make “real profits for 10 or 20 years.”
Lutin
agrees with the conventional wisdom that “index funds are the right way to
secure the farm,” because of their low cost, diversification and good
track record against most active fund managers.
But in an
interview on Oct. 26, Lutin said: “If you want to go beyond securing the
farm, invest in five to 10 stocks you are familiar with, based on their
ability to compete in the production of goods and services for 20 years.”
Considering how fixated the financial media are on the day-to-day
performance of the stock market and quarterly performance of companies,
the idea of “going in” for 20 years might seem odd. But it can really pay
off.
Nike’s long-term success
For
starters, you will want to hold stock in a company that makes products you
believe will remain popular, necessary or both, for a long time. For
example, we recently discussed Nike Inc. because it had been 30 years
since Marty McFly, in “Back to the Future Part II,” had traveled from 1985
to 2015.
McFly wore Nike sneakers in 1985 and bought new ones in 2015. It turned
out that among S&P 500 stocks,
Nike was the best performer for
the 30-year period, with dividends reinvested. The stock returned an
astounding 46,922%. This means a $10,000 investment made on Oct. 25, 1985,
would have been worth $4.69 million on Oct. 20, 2015.
Anybody
would have been hard-pressed to commit to any stock for 30 years in 1985.
But even then, Nike had a commanding market position for athletic shoes in
the United States, and it was pretty obvious that people would still need
the types of products it was making for decades to come.
That part
of the stock-selection process is something you will have to keep in mind,
because looking at numbers underscoring historical financial success won’t
tell you if a company’s products or services may fall by the wayside. But
a long-term track record of success could indicate a strong management
culture.
Return on invested
capital
When Lutin
of the Shareholder Forum suggested that investors should try to think
decades ahead before making a long-term investment, he was encompassing
many factors, including executive pay, and how a company treats its
employees, customers and shareholders. But in an interview last week, he
said investors should look at a company’s return on invested capital, or
ROIC.
FactSet
defines ROIC as earnings divided by the sum of the carrying value (not the
market value) of a company’s common stock, preferred stock, long-term debt
and capitalized lease obligations.
Ralph
Segall, chief investment officer of Chicago-based Segall Bryant & Hamill,
which has about $10 billion in assets under management, also has suggested
ROIC is a useful metric for investors. In an interview on Oct. 30, Segall
said that when analyzing companies for possible investments, his research
team considers ROIC, “using a discount rate that is broadly
market-driven.”
“We do not
sort by industry or sector. We just use one cost of capital for all
equities,” Segall said.
That’s an
interesting statement, because some industries are more capital intensive
than others, so it might not be “fair” to compare an auto manufacturer
with Facebook Inc. for example, since one requires much more capital
investment than the other.
Segall
called ROIC “our North Star.”
“It helps
us orient where we are and understand why we own something. We know we are
going to be wrong about many forecasts. Quarterly earnings are random
events. If stocks are going down, we need to know if we misunderstood
these or if the market did, in which case it gives us an opportunity to
add,” he said.
First, a ‘fair’
comparison
We thought
it would be useful to look further at Nike and other apparel and footwear
manufacturers, to see how their ROIC compared over longer periods. Since
there are only six apparel manufacturers among the S&P 500, we expanded
the list to the 19 included in the S&P 1500 Composite Index.
FactSet
has five years of ROIC data for 18 of these 19 companies. For Michael Kors
Inc. FactSet’s data goes back only three years, but for the past 12
quarters, the annualized average ROIC for the company has been a very high
46.5%. Still, the stock is down 40% over the past 12 months and its
three-year return has been a negative 22%. This shows the fickleness of
the fashion market. Concerns that slowing economic growth in China will
lead to sliding sales of luxury handbags and similar items have weighed on
the stock.
It’s easy
to show that Michael Kors has achieved a very impressive ROIC, but
predicting fashion trends is, at least for me, impossible.
Here are
the 10 companies in the S&P 1500 apparel/footwear category with the
highest annualized average returns on invested capital over the past 20
quarters:
|
Company
|
Ticker
|
Average return on invested capital -
past five years through most recent reported quarter
|
|
Nike Inc. Class B |
NKE |
22.5% |
|
Deckers
Outdoor Corp. |
DECK |
21.2% |
|
Steven Madden Ltd. |
SHOO |
20.6% |
|
Ralph Lauren Corp. Class A |
RL |
17.3% |
|
Guess Inc. |
GES |
17.0% |
|
G-III Apparel Group Inc. |
GIII |
16.6% |
|
V.F.
Corp. |
VFC |
15.7% |
|
Under Armour Inc. Class A |
UA |
15.1% |
|
Crocs Inc. |
CROX |
12.2% |
|
Wolverine World Wide Inc. |
WWW |
11.9% |
|
Source: FactSet |
Once
again, Nike is on top with an average ROIC of 22.5% for the past five
years through the end of its fiscal first quarter on Aug. 31.
Here’s how
the same apparel/footwear companies’ stocks have performed, with dividends
reinvested, through Nov. 6:
|
Company
|
Ticker
|
Total return - 3 years
|
Total return - 5 years
|
Total return - 10 year
|
|
Nike Inc. Class B |
NKE |
184% |
234% |
593% |
|
Deckers
Outdoor Corp. |
DECK |
63% |
-12% |
819% |
|
Steven Madden Ltd. |
SHOO |
17% |
86% |
581% |
|
Ralph Lauren Corp. Class A |
RL |
-11% |
45% |
168% |
|
Guess Inc. |
GES |
3% |
-33% |
77% |
|
G-III Apparel Group Inc. |
GIII |
178% |
249% |
1,448% |
|
V.F.
Corp. |
VFC |
81% |
259% |
567% |
|
Under Armour Inc. Class A |
UA |
258% |
664% |
N/A |
|
Crocs Inc. |
CROX |
-21% |
-31% |
N/A |
|
Wolverine World Wide Inc. |
WWW |
-9% |
32% |
107% |
|
S&P 1500 Composite Index
|
|
56%
|
90%
|
115%
|
|
Source: FactSet |
As you can
see, the group fared best against the index for the 10-year period. This
underlines how important it is to look at the numbers but also to
really understand what’s going on with a company. For example, Ralph
Lauren, the founder of Ralph Lauren Corp. announced on Sept. 29 that he
would step down as CEO, although the company said he would “continue to
actively drive the company’s vision and strategy as executive chairman and
chief creative officer.” The stock rose 14% that day.
The point
is not to bash Ralph Lauren’s accomplishments, but to emphasize that a
company named after the founder and current CEO has quite a bit riding on
his or her performance and personality.
It is
critical that you, as an investor, really understand how popular and
lasting a company’s products might be. If the company’s specialty is
highly fashionable products, and you have little knowledge in that area,
some caution is warranted.
Of course,
one should also check to see how a company’s sales have fared, since a
slow growth rate could point to a deeper underlying problem.
Here are
sales-per-share growth numbers for the same 10 apparel/footwear companies
over the past 12 reported months:
|
Company
|
Ticker
|
Sales per share - past 12 reported
months
|
Sales per share - year earlier
|
Change in sales per share
|
|
Nike Inc. Class B |
NKE |
$35.34 |
$32.09 |
10% |
|
Deckers
Outdoor Corp. |
DECK |
$53.75 |
$43.25 |
24% |
|
Steven Madden Ltd. |
SHOO |
$22.77 |
$20.66 |
10% |
|
Ralph Lauren Corp. Class A |
RL |
$85.61 |
$83.78 |
2% |
|
Guess Inc. |
GES |
$27.19 |
$29.71 |
-8% |
|
G-III Apparel Group Inc. |
GIII |
$48.52 |
$45.75 |
6% |
|
V.F.
Corp. |
VFC |
$28.95 |
$27.12 |
7% |
|
Under Armour Inc. Class A |
UA |
$16.75 |
$13.22 |
27% |
|
Crocs Inc. |
CROX |
$14.03 |
$13.93 |
1% |
|
Wolverine World Wide Inc. |
WWW |
$27.11 |
$26.89 |
1% |
|
Source: FactSet |
An ‘unfair’ comparison
Getting
back to Ralph Segall’s comment that “we do not sort by industry or
sector,” when considering ROIC, we’ve prepared another list that covers
all industries.
Lutin said
investors really should select companies “you understand and have
confidence in,” before selecting stocks. If you are building a broad,
diversified portfolio, he also said, “there is merit” to starting with
highest ROIC, regardless of industry.
Here’s a
list of S&P 1500 stocks, regardless of industry, with the highest ROIC
over the past 20 reported quarters:
|
Company
|
Ticker
|
Industry
|
Average return on invested capital -
past five years through most recent reported quarter
|
|
VeriSign
Inc. |
VRSN
|
Internet software/ Services |
135.0% |
|
Accenture
PLC |
ACN |
Information Technology Services |
61.6% |
|
Domino’s Pizza Inc. |
DPZ |
Restaurants |
56.1% |
|
Philip Morris International Inc. |
PM |
Tobacco |
51.8% |
|
Moody’s Corp. |
MCO
|
Financial publishing/ services |
50.6% |
|
Computer Programs and Systems Inc. |
CPSI |
Health care information technology
systems |
48.1% |
|
AutoZone Inc. |
AZO |
Specialty stores |
47.7% |
|
Blue Nile Inc. |
NILE |
Internet retail - jewelry |
47.2% |
|
Select Comfort Corp. |
SCSS |
Home furnishings |
46.0% |
|
MasterCard Inc. Class A |
MA |
Payment processing |
42.5% |
|
Source: FactSet |
Here’s how
these companies’ stocks have performed through Nov. 6:
|
Company
|
Ticker
|
Total return - 3 years
|
Total return - 5 years
|
Total return - 10 years
|
|
VeriSign
Inc. |
VRSN |
104% |
176% |
315% |
|
Accenture
PLC |
ACN |
65% |
160% |
384% |
|
Domino’s Pizza Inc. |
DPZ |
164% |
672% |
714% |
|
Philip Morris International Inc. |
PM
|
13% |
77% |
N/A |
|
Moody’s Corp. |
MCO |
127% |
283% |
118% |
|
Computer Programs and Systems Inc. |
CPSI
|
-7% |
5% |
55% |
|
AutoZone Inc. |
AZO |
107% |
232% |
827% |
|
Blue Nile Inc. |
NILE |
-8% |
-21% |
4% |
|
Select Comfort Corp. |
SCSS |
-12% |
181% |
65% |
|
MasterCard Inc. Class A |
MA |
119% |
304% |
N/A |
|
Source: FactSet |
There are
many impressive numbers on the table above. Those companies could be a
starting point for your own homework.
Finally,
here’s how the 10 S&P 1500 companies, regardless of industry, have done
increasing sales per share over the past 12 months:
|
Company
|
Ticker
|
Sales per share - past 12 reported
months
|
Sales per share - year earlier
|
Change in sales per share
|
|
VeriSign
Inc. |
VRSN |
$7.80 |
$6.93 |
13% |
|
Accenture
PLC |
ACN |
$48.49 |
$46.03 |
5% |
|
Domino’s Pizza Inc. |
DPZ |
$37.40 |
$33.55 |
11% |
|
Philip Morris International Inc. |
PM |
$17.76 |
$19.14 |
-7% |
|
Moody’s Corp. |
MCO |
$16.98 |
$14.93 |
14% |
|
Computer Programs and Systems Inc. |
CPSI |
$16.64 |
$18.91 |
-12% |
|
AutoZone Inc. |
AZO |
$316.61 |
$279.98 |
13% |
|
Blue Nile Inc. |
NILE
|
$41.29 |
$36.93 |
12% |
|
Select Comfort Corp. |
SCSS |
$25.03 |
$19.53 |
28% |
|
MasterCard Inc. Class A |
MA |
$8.35 |
$7.79 |
7% |
|
Source: FactSet |
There are
two types of value investing. One way is to select stocks that you think
are priced too low in relation to their intrinsic value. You’re hoping
that somebody else will decide to pay significantly more for your stock in
a relatively short time.
But the
other type of value investing involves a much longer-term view. If you
select companies that keep achieving high returns on invested capital and
have products or services you believe will be popular or necessary for
decades to come, then it may not matter so much whether you pay the lowest
possible price for the shares.
“Price
tends to converge on intrinsic value. That’s the foundation concept of
Graham and Dodd and Buffet-style value investing,” Lutin said, referring
to Benjamin Graham, David Dodd and Warren Buffett, the most legendary
value investors.
“Sometimes
you will pay 10% more than the current discounted present value, and
sometimes you will pay 10% less. Over 20 years, if you do either, you’ll
be OK if the company in fact competes successfully and continues to
produce a decent ROIC.”
|
Copyright
©2015 MarketWatch, Inc. |
|